Free Social Media Report Template for 2026
A ready-to-use monthly social media report template with every section you need. Copy it, fill in your numbers, and present results your team can actually act on.
No credit card required · 7-day free trial · Plans from $19/mo
What Is a Social Media Report Template?
A social media report template is a pre-built framework that organizes your platform metrics, content performance, and audience growth data into a structured document you can fill out each month. It eliminates the blank-page problem and ensures you track the same metrics consistently over time, making month-over-month comparisons straightforward and actionable for your team.
Consistent reporting is the backbone of any effective social media strategy. Without a standardized template, teams waste time reinventing the format every month and risk overlooking critical metrics that reveal whether their content strategy is actually working. A well-structured report transforms raw analytics data into a narrative that stakeholders understand and can act on. Whether you are reporting to a client, a marketing director, or your own executive team, the template below gives you every section you need to demonstrate value and identify areas for improvement. The key is to keep the format consistent month after month so that trends become visible and data-driven decisions become second nature rather than a quarterly scramble through disconnected spreadsheets and screenshots from native platform dashboards.
According to Hootsuite, teams that use standardized social media reporting templates spend 40% less time on report preparation while producing more actionable insights. The structure itself forces you to look at the right metrics instead of cherry-picking numbers that tell a comfortable story. Not sure which metrics belong in your report? Start with our guide to the 15 social media KPIs worth tracking.
Monthly Social Media Report Template
Copy this template and fill in your numbers each month. Each section includes the metrics you should track and a column for month-over-month changes so you can spot trends at a glance.
1. Executive Summary
| Item | This Month | Change |
|---|---|---|
| Reporting Period | [Month Year] | -- |
| Total Posts Published | [number] | [+/- vs last month] |
| Platforms Active | [list platforms] | -- |
| Highlight of the Month | [one-sentence win] | -- |
| Overall ROI | [percentage or ratio] | [+/- vs last month] |
2. Reach & Impressions
| Platform | Impressions | Reach | Change |
|---|---|---|---|
| [number] | [number] | [+/-%] | |
| [number] | [number] | [+/-%] | |
| [number] | [number] | [+/-%] | |
| [number] | [number] | [+/-%] | |
| Total | [sum] | [sum] | [+/-%] |
3. Engagement Metrics
| Platform | Likes | Comments | Shares | Eng. Rate |
|---|---|---|---|---|
| [num] | [num] | [num] | [%] | |
| [num] | [num] | [num] | [%] | |
| [num] | [num] | [num] | [%] | |
| [num] | [num] | [num] | [%] |
4. Follower Growth
| Platform | Start of Month | End of Month | Net Change | Growth % |
|---|---|---|---|---|
| [num] | [num] | [+/-] | [%] | |
| [num] | [num] | [+/-] | [%] | |
| [num] | [num] | [+/-] | [%] | |
| [num] | [num] | [+/-] | [%] |
5. Top Performing Posts
| Rank | Platform | Post Summary | Engagements | Reach |
|---|---|---|---|---|
| 1 | [platform] | [brief description] | [num] | [num] |
| 2 | [platform] | [brief description] | [num] | [num] |
| 3 | [platform] | [brief description] | [num] | [num] |
6. Key Learnings
- [What content type performed best this month and why?]
- [Which platform showed the most growth or decline?]
- [What surprised you about this month's data?]
- [What should you do more of / less of next month?]
7. Next Month Goals
| Goal # | Goal | Target Metric | Deadline |
|---|---|---|---|
| 1 | [e.g., Increase LinkedIn engagement rate] | [e.g., 3.5%] | [date] |
| 2 | [e.g., Grow Instagram followers by 200] | [e.g., 2,400 total] | [date] |
| 3 | [e.g., Test video content on Facebook] | [e.g., 5 videos published] | [date] |
How to Fill Out Your Monthly Social Media Report
Follow these five steps at the end of each month to complete your report in under 30 minutes. The goal is not to create a beautiful document -- it is to capture the data that drives better decisions next month.
Pull raw data from each platform
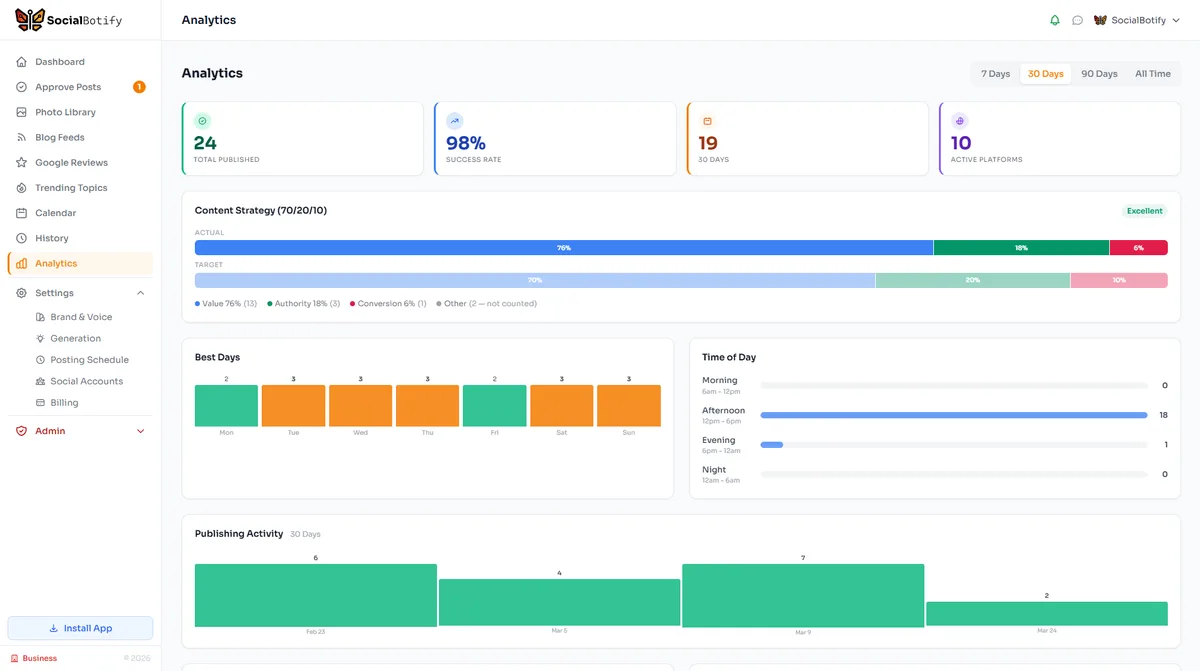
Log into each platform's native analytics dashboard (LinkedIn Analytics, Meta Business Suite, X Analytics) and export the monthly data. If you use SocialBotify, your publishing data is already centralized -- pull reach and engagement from native dashboards to complement it.
Fill in the numbers, not just totals
Enter platform-specific metrics for reach, engagement, and follower growth. Avoid lumping everything into a single total because platform-level data reveals which channels deliver value and which need adjustment.
Calculate month-over-month changes
Compare every metric to the previous month. A 15% drop in Instagram reach is more useful to know than the absolute number. Trends -- not snapshots -- drive smart content decisions. Use your ROI measurement framework to connect these numbers to revenue.
Identify your top 3 posts and explain why they worked
Sort by engagement or reach and select the top three. Write one sentence about why each post resonated: was it the topic, the format, the timing, or the visual? This analysis is where reporting turns into strategy for next month.
Set 2-3 specific goals for next month
Goals should be measurable and tied to a single metric. Instead of "get more engagement," write "increase LinkedIn engagement rate from 2.1% to 2.5% by posting 3x per week with image-based content." Concrete goals make your next report easier to evaluate.
What Social Media Metrics Should You Include?
The metrics in your social media report should match your business goals, but certain metrics belong in every report regardless of industry. Reach and impressions tell you how many people saw your content, which is the foundation of awareness. Engagement rate tells you whether those people cared enough to interact, which is the foundation of trust. Follower growth rate shows whether your audience is expanding or contracting over time. Click-through rate connects social activity to website traffic, which is where conversions happen for most businesses. And cost per acquisition ties everything back to the financial question that leadership cares about most: how much does each new customer from social media actually cost us? These five metrics together paint a complete picture of social media performance without drowning stakeholders in data they cannot act on.
Sprout Social's 2026 benchmarks report found that businesses tracking five or more metrics in monthly reports are 2.3 times more likely to report positive ROI from social media. Measurement discipline correlates directly with performance because it forces teams to pay attention to what matters rather than relying on gut feeling about what is working.
For a deeper dive into which KPIs drive real business results, see our complete guide to social media KPIs that actually matter. If you are generating content with AI tools like SocialBotify's AI post generator, your report should also track content volume and approval rate to ensure quality stays high as output scales up.
How Often Should You Create Social Media Reports?
Monthly reports are the sweet spot for most businesses and agencies. Weekly reporting creates data noise because social media performance fluctuates naturally from week to week, and reacting to every dip wastes energy on short-term variance rather than long-term trends. Quarterly reporting waits too long to catch problems, meaning three months of suboptimal content could pass before anyone notices a declining engagement rate or a platform that stopped delivering reach. Monthly cadence gives you enough data points to identify genuine trends while keeping the feedback loop tight enough to course-correct before small issues become expensive ones. Agency teams managing multiple client accounts may want to add a brief weekly check on key metrics like reach and engagement rate to flag urgent issues between formal reports.
HubSpot's State of Marketing data shows that 67% of high-performing marketing teams review social media analytics at least monthly, compared to just 34% of teams that describe their social media performance as below expectations. The correlation between reporting frequency and performance is one of the strongest signals in marketing operations research, suggesting that the act of measuring itself improves outcomes by keeping teams accountable to data-driven standards rather than subjective impressions of how things are going.
Frequently Asked Questions
What should a social media report include?
A social media report should include an executive summary, reach and impressions data, engagement metrics (likes, comments, shares), follower growth numbers, a list of top-performing posts, key learnings from the reporting period, and goals for the next month. Including platform-specific breakdowns helps stakeholders understand which channels deliver the most value.
How often should I create a social media report?
Most businesses benefit from monthly social media reports. Monthly reporting gives you enough data to identify trends without overwhelming stakeholders. Weekly spot-checks on key metrics like engagement rate and reach help you catch problems early, while quarterly reports are better suited for strategic reviews and budget allocation decisions.
How long should a social media report be?
A social media report should be one to three pages for most businesses. Executives want a one-page summary with key metrics and takeaways. Marketing teams may need two to three pages with platform breakdowns and content analysis. Avoid reports longer than five pages because stakeholders stop reading after the first few pages regardless of how much data you include.
What tools can I use to automate social media reporting?
You can use native platform analytics (LinkedIn Analytics, Meta Business Suite, X Analytics) for free data. For consolidated reporting across multiple platforms, tools like SocialBotify, Sprout Social, and Hootsuite pull metrics into a single dashboard. SocialBotify also handles content creation and scheduling, so your reporting data reflects a consistent posting strategy rather than sporadic activity.
What is the best format for a social media report?
The best format depends on your audience. For executive stakeholders, use a one-page summary with key metrics and month-over-month changes. For marketing teams, use a structured template with tables for each metric category and a section for top-performing posts. Google Slides or a simple document works for most teams. Avoid over-designed reports that take longer to produce than they take to read.
Want to Connect Your Report to Revenue?
Tracking metrics is step one. Connecting them to business outcomes is step two. Our ROI measurement guide shows you the exact formulas and worked examples to prove the value of every post you publish.
Automate Your Social Media Content
Great reports start with consistent content. SocialBotify generates, schedules, and publishes posts across 10 platforms so your monthly numbers actually tell a growth story.
No credit card required · 7-day free trial · Plans from $19/mo