15 Social Media KPIs That Actually Matter in 2026
Social media KPIs are quantifiable metrics tied directly to business objectives that measure whether your social media strategy is working. This guide covers the 15 KPIs worth tracking, their formulas, and realistic benchmarks so you can stop guessing and start measuring what matters.
No credit card required · 7-day free trial · Plans from $19/mo
What Are Social Media KPIs and Why Do They Matter?
Social media KPIs, or key performance indicators, are specific metrics that measure progress toward your business goals through social media channels. Unlike vanity metrics that look impressive in screenshots but reveal nothing about business impact, KPIs are tied directly to outcomes that affect revenue, brand growth, or customer acquisition. The distinction is critical because what you measure determines what you optimize. If you only track follower count, you will optimize for follower growth, which may have zero correlation with actual sales. If you track conversion rate and cost per acquisition, you will optimize for content that drives qualified traffic and turns visitors into customers. Every social media strategy should start with defining which KPIs matter most, then build content and scheduling decisions around improving those specific numbers over time.
Hootsuite's 2026 Social Trends Report found that 67% of social media marketers struggle to prove the value of their work to leadership. The root cause is almost always the same: they are reporting metrics that sound good but do not connect to the numbers executives care about. KPIs bridge that gap by translating social media activity into business language.
Understanding your KPIs also makes it easier to measure your social media ROI accurately, because ROI calculations depend on having the right data inputs from the start.
The 15 Social Media KPIs You Should Know
The table below is a quick-reference guide to the social media metrics and KPIs that matter most in 2026. Each includes a plain-English definition, the formula for calculating it, and a realistic benchmark range across platforms.
| KPI | Definition | Formula | Benchmark |
|---|---|---|---|
| Engagement Rate | Percentage of audience that interacts with your content | (Likes + Comments + Shares) / Impressions × 100 | 1% – 5% |
| Reach | Number of unique users who saw your content | Unique viewers per post (platform-reported) | 10% – 30% of followers |
| Impressions | Total number of times your content was displayed | Total displays (platform-reported, includes repeats) | 1.2x – 2x reach |
| Click-Through Rate | Percentage of viewers who clicked a link in your post | Link Clicks / Impressions × 100 | 0.5% – 2.5% |
| Conversion Rate | Percentage of social visitors who complete a desired action | Conversions / Social Visitors × 100 | 1% – 5% |
| Cost Per Click | Average cost for each click on your social content or ads | Total Spend / Total Clicks | $0.50 – $3.00 |
| Share of Voice | Your brand mentions as a proportion of total industry mentions | Your Mentions / Total Industry Mentions × 100 | 5% – 20% |
| Audience Growth Rate | Speed at which your follower count increases over time | New Followers / Total Followers × 100 | 1% – 3% monthly |
| Video Completion Rate | Percentage of viewers who watched your video to the end | Complete Views / Total Views × 100 | 15% – 40% |
| Follower-to-Engagement Ratio | How actively your followers engage relative to audience size | Total Engagements / Total Followers × 100 | 1% – 6% |
| Response Time | Average time to reply to comments, DMs, or mentions | Sum of Response Times / Number of Responses | Under 2 hours |
| Saves / Bookmarks | Number of times users saved your post for later reference | Total Saves (platform-reported) | 1% – 3% of reach |
| Story Completion Rate | Percentage of viewers who watched all frames of your story | Last Frame Views / First Frame Views × 100 | 60% – 80% |
| Virality Rate | Ratio of shares to impressions, measuring content spread | Shares / Impressions × 100 | 0.5% – 3% |
| Customer Acquisition Cost | Total cost to acquire one customer through social channels | Total Social Spend / New Customers from Social | $15 – $200 |
Benchmarks are cross-platform median ranges based on 2025-2026 industry data. Your actual numbers will vary by industry, audience size, and content type.
Vanity Metrics vs. Actionable KPIs
The most common mistake in social media measurement is confusing activity metrics with performance indicators. Vanity metrics like follower count, total likes, and page views feel satisfying because the numbers are large and always growing, but they tell you almost nothing about whether your social media strategy is generating business value. A page with fifty thousand followers and a 0.1% engagement rate is underperforming compared to a page with five thousand followers and a 4% engagement rate, because the second page has a genuinely engaged audience that is more likely to click, convert, and buy. Actionable KPIs differ from vanity metrics in one critical way: they inform decisions. If your engagement rate drops from 3.2% to 1.8% over three weeks, that data tells you something is wrong with your content strategy and you need to adjust. If your follower count grows from ten thousand to ten thousand five hundred, that number alone tells you nothing about whether those new followers will ever engage with or buy from your business.
HubSpot's marketing research found that teams focusing on actionable KPIs rather than vanity metrics are 3x more likely to report their social media strategy as effective. The shift from vanity to actionable measurement is often the single biggest improvement a social media program can make. Using an AI social media post generator that optimizes content for engagement rather than volume makes this shift much easier to implement.
How to Choose the Right KPIs for Your Business?
Choosing the right social media KPIs starts with working backward from your business objectives. If your primary goal is brand awareness, your KPIs should center on reach, impressions, and audience growth rate. If you are focused on driving website traffic, click-through rate and referral traffic volume are your primary indicators. For direct revenue attribution, conversion rate and customer acquisition cost should take priority. The mistake most businesses make is tracking the same generic set of KPIs regardless of their goals, industry, or stage of growth. A startup trying to build initial awareness needs different KPIs than an established brand optimizing for conversions. A B2B company selling high-value consulting engagements should weight lead quality metrics more heavily than a D2C e-commerce brand that can measure direct purchase attribution. The right KPI framework evolves as your business grows and your social media maturity increases.
Sprout Social recommends mapping each KPI to a specific business objective before adding it to your reporting dashboard. If you cannot explain how a metric connects to revenue, customer acquisition, or brand growth, it does not belong in your KPI framework. Once you have your KPIs defined, use our social media report template to organize and present them consistently each month.
Define your business objective first
Awareness, traffic, leads, or sales? Your answer determines which KPIs matter.
Pick one KPI per category
Choose one awareness, one engagement, and one conversion KPI to start. Three to five total is the sweet spot.
Set a baseline before optimizing
Track your chosen KPIs for 30 days before making strategy changes. You need a baseline to measure improvement against.
Review and adjust quarterly
Reassess your KPI framework every quarter. As goals shift, your measurement should shift with them.
Building a content strategy around your chosen KPIs ensures every post you publish is working toward a measurable goal rather than filling a content calendar for its own sake.
Platform-Specific KPI Benchmarks
Benchmarks vary significantly across platforms because each platform has different algorithms, audience behaviors, and content formats. A 2% engagement rate on LinkedIn is average, while 2% on Instagram is below par. The data below reflects median performance for business accounts in 2025-2026 based on industry research from Hootsuite and Sprout Social.
| KPI | Twitter/X | |||
|---|---|---|---|---|
| Engagement Rate | 2.0% – 5.0% | 1.5% – 3.5% | 0.5% – 1.5% | 0.5% – 1.2% |
| Organic Reach | 8% – 15% | 10% – 25% | 3% – 8% | 2% – 6% |
| Click-Through Rate | 1.5% – 3.0% | 0.5% – 1.5% | 0.8% – 2.0% | 0.5% – 1.5% |
| Audience Growth | 1% – 2% /mo | 1% – 3% /mo | 0.5% – 2% /mo | 0.5% – 1.5% /mo |
| Video Completion | 20% – 35% | 15% – 30% | 10% – 25% | 15% – 30% |
| Save Rate | N/A | 1% – 3% | 0.2% – 0.8% | 0.3% – 1.0% |
Consistent posting is the single strongest lever for improving all of these benchmarks. Social media automation ensures you never miss a posting window, and algorithms reward accounts that post on a predictable schedule with higher organic reach over time.
Frequently Asked Questions
What is the difference between KPIs and metrics in social media?
All KPIs are metrics, but not all metrics are KPIs. A metric is any quantifiable measurement, such as follower count or impressions. A KPI (key performance indicator) is a metric that directly ties to a specific business objective. For example, impressions are a metric, but conversion rate is a KPI because it measures progress toward the goal of acquiring customers. The distinction matters because tracking too many metrics without prioritizing KPIs leads to analysis paralysis and unfocused strategy.
How many social media KPIs should I track?
Most businesses should track between three and five core KPIs. Tracking fewer than three leaves blind spots in your strategy, while tracking more than seven creates noise that obscures meaningful patterns. Start with one KPI from each category: awareness (reach or impressions), engagement (engagement rate), and conversion (click-through rate or conversion rate). Add platform-specific KPIs only after you have a baseline for the core three.
What is a good engagement rate on social media in 2026?
A good engagement rate varies by platform. On Instagram, the median engagement rate is 1.5% to 3.5% for business accounts. LinkedIn sees higher rates of 2% to 5% for company pages with active audiences. Twitter/X averages 0.5% to 1.5%, and Facebook business pages typically see 0.5% to 1.2%. Any rate above your platform average indicates strong content-audience fit. The key is to benchmark against your own past performance and industry peers rather than cross-platform averages.
How often should I review my social media KPIs?
Review engagement and reach KPIs weekly to catch underperforming content early. Analyze conversion-focused KPIs like click-through rate and cost per click monthly, since these need larger sample sizes to be statistically meaningful. Conduct a full KPI audit quarterly to reassess which metrics still align with your business goals. Annual reviews should evaluate whether your KPI framework itself needs restructuring based on changes in platform algorithms, audience behavior, or business strategy.
Can AI tools help improve social media KPIs?
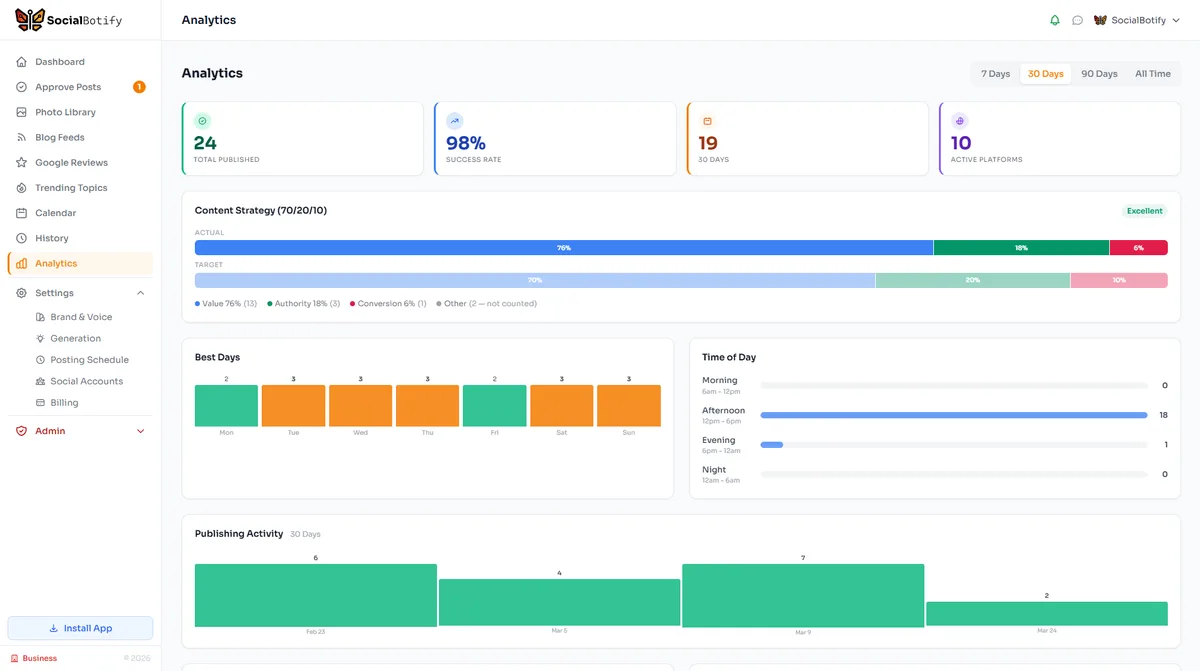
Yes, AI tools directly improve social media KPIs in three ways. First, AI-generated content trained on high-performing patterns tends to produce higher engagement rates than rushed manual content. Second, automated scheduling ensures consistent posting frequency, which algorithms reward with increased reach and impressions. Third, AI reduces content creation costs, improving cost-related KPIs like cost per click and customer acquisition cost. Tools like SocialBotify handle content creation, platform optimization, and scheduling across ten platforms, letting you focus on strategy and community engagement.
Start Improving Your Social Media KPIs Today
SocialBotify creates platform-optimized content, posts on a consistent schedule, and helps you focus on the KPIs that drive real business results. Start your free trial and see the difference data-driven social media makes.
No credit card required · 7-day free trial · Plans from $19/mo